
Matlab Plotting - Horizontal Lines and Vertical lines1.- Basics2.- Code 3.- Applied Example 4.- Video (alternative code) 1.- BasicsWe are going to create a simple Matlab function to add horizontal lines (and vertical ones) to any given Matlab-created plot.For example, let's say that we need to add some indications or annotations to a plot, and we need to display and indicate some upper or lower limits. The proposed Matlab function will have 5 input parameters:
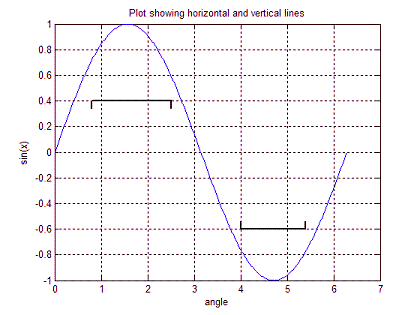
We plan the usage of our function like this (its name will be 'plot_limit'): Usage: L = [L_min L_max y d r]; plot_limit(L); where L_min = starting point L_max = ending point y = y value of horizontal line d = direction (1 or -1) r = y range So, we need to know in advance where we want to put our line (sure!). We define our horizontal and vertical values. We arbitrarily define 300 horizontal points and use a linewidth = 1.5. The instruction 'hold on' keeps the current figure, instead of overwriting it. This Matlab code displays just a horizontal line. a = linspace(L_min, L_max, 300); b = linspace(y, y, 300); plot(a,b,'k-','linewidth',1.5) hold on Then, we add some tiny vertical lines on each side of the horizontal one. If direction 'd' is 1, the vertical lines are below the horizontal line (going 'up'). If direction 'd' is -1, the vertical lines are above the horizontal one (going 'down'). We take the vertical range into account, in 'r', to display a vertical line of just 3% of the total 'height' of the current figure. You can try different values to suit your needs, obviously. We find the initial or final points of the vertical lines with an 'if-statement'. 2.- CodeThis is the code to achieve it.% Initial vertical line a = linspace(L_min, L_min, 10); if d == 1 b = linspace(y-r*.03, y, 10); else b = linspace(y, y+r*.03, 10); end plot(a,b,'k-','linewidth',1.5) hold on % Final vertical line a = linspace(L_max, L_max, 10); if d == 1 b = linspace(y-r*.03, y, 10); else b = linspace(y, y+r*.03, 10); end plot(a,b,'k-','linewidth',1.5) 3.- Applied ExampleNow, we'll test our function with this script.clear; clc; close all x = 0 : 2*pi/360 : 2*pi; y = sin(x); plot(x,y) grid on xlabel('angle') ylabel('sin(x)') title('Plot showing horizontal and vertical lines') hold on plot_limit([0.8, 2.5, 0.4, 1, 2]) plot_limit([4, 5.4, -0.6, -1, 2]) The result is:  The second line starts at 4, ends at 5.4, and has a vertical value of -0.6. Direction goes down (d = -1). 4.- VideoFrom 'Horizontal Lines' to home From 'Horizontal Lines' to 2D plots
|

