Student's
t distribution
|
This
algorithm (the Matlab code developed below) calculates right-tail values
for points on a
t-distribution
curve. You must provide the value of t and the degrees of
freedom.
The
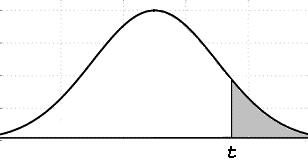
t-distribution is a continuous distribution that arises when
estimating the mean of a normally distributed population in situations
where the sample size is small. |
 |
| Student's
t-distribution curve |
The
shaded area represents the right-tail value for t.
The
right-tail value is approximated using the following formula:

where
a1
= 0.196854
a2
= 0.115194
a3
= 0.000344
a4
= 0.019527
d =
degrees of freedom

The
Matlab program is:
%
Clears screen and deletes all the variables in the workspace
clc;
clear;
%
Asks the user for input
t =
input('T-value:
');
d =
input('Degrees
of freedom: ');
x = 1;
y = 1;
t = t^2;
%
Computes using inverse for small T-values
if t <
1
s
= d;
r
= y;
z
= 1/t;
else
s = y;
r
= d;
z
= t;
end
j =
2/(9*s);
k =
2/(9*r);
%
Computes using approximation formulas
l =
abs((1 - k)*z^(1/3) - 1 + j)/sqrt(k*z^(2/3) + j);
if r <
4
l
= l*(1 + 0.08*l^4/r^3);
end
a1 =
0.196854;
a2 =
0.115194;
a3 =
0.000344;
a4 =
0.019527;
x =
0.25/(1 + l*(a1 + l*(a2 + l*(a3 + l*a4))))^4;
x =
floor(x*10000 + 0.5)/10000;
%
Adjusts if inverse was calculated
if t <
1
x
= 1 - x;
end
%
Displays result
str
= ['Rigth
tail value: ' num2str(x)];
disp(str)
Example
1:
What is
the right-tail value
when the t-value
is 2.921 and there are 16 degrees
of
freedom?
We run
the code above and enter data:
T-value:
2.921
Degrees
of freedom: 16
Matlab
answer is
Rigth
tail value: 0.0049
Example
2:
T-value
is 11.178, with 5 degrees of freedom. What’s the tail value?
Running
the program and entering appropriate data, we get:
T-value:
11.178
Degrees
of freedom: 5
Rigth
tail value: 0.0002
From
't distribution' to
home
From
't distribution' to 'Probability and Statistics' Menu
Sitemap
- Table of
Contents


|


