
3D plot – Part 3
Continuing with our 3D graphs, we'll demonstrate the
use of the function '
sphere'. We are
going to draw a unit sphere centered at the origin and
generated by matrices
x,
y
and
z, of size 31 x 31 each.
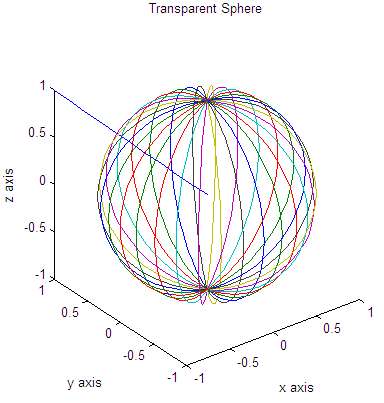
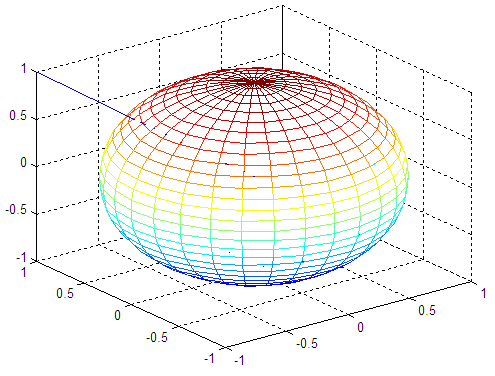
Just as an exercise, we also add a straight line going from the center of the sphere to one of the corners in the figure (within the same 3D plot). This is important to note the fact that we can add several shapes to the figure, by using the instruction ' hold on '. We'll also use functions to label the plot and will see how we can use two coordinates to find more elements of the line containing them. Example: We plot a transparent sphere using appropriate commands. We add a line from the center of the sphere to one corner of the containing box. We demonstrate the use of the instruction ' axis' with the parameter ' square'. % cleans the workspace clc; clear; close all % returns the coordinates of a sphere in three % matrices that are (n+1)-by-(n+1) in size [x, y, z] = sphere(30); plot3(x,y,z) % keeps the proportions in place and writes appropriate info. axis('square') title('Transparent Sphere') xlabel('x axis') ylabel('y axis') zlabel('z axis') % keeps the above sphere in order to superimpose a line hold on % the line goes from (-1, 1, 1) to (0, 0, 0) a = -1 : .1 : 0; b = 1 : -.1 : 0; c = b; plot3(a, b, c) % draws the sphere in another format and in another figure % see what happens if we don't use the axis('square') instruction figure mesh(x,y,z) hold on plot3(a, b, c) And the resulting figures are: 

Part 1 - view, grid, subplot Part 2 - meshgrid, plot3, meshc, surfc Part 4 - meshgrid, figure, contour3, mesh, surfl From '3D Plot Part 3' to home From '3D Plot Part 3' to 3D Main Top |
undefined undefined undefined undefined undefined undefined undefined undefined undefined undefined undefined undefined undefined undefined undefined undefined undefined |
