
RGB images - an introduction to image processing algorithmsWe’ll show some basic ideas on RGB images (or image processing in Matlab). These concepts are fundamental and don’t require any special toolbox.An image in Matlab is a matrix m x n containing colors to be displayed. The colors have to be defined in a color map, which is another matrix. A color map matrix may have any number of rows, but it must have exactly three columns. First experiment: define some colors and show them
%
We prepare the matrix that contains the colors to be displayed %
We use the 'colormap' function to define the actual %
We use the 'image' instruction to display the matrix %
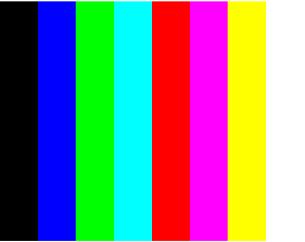
We don't want to show values along the axes, for the moment This is the image produced
Second experiment: define random colors and display them (5 times)Press any key (or click the mouse) to change the colors to be visualized... w = [1 2
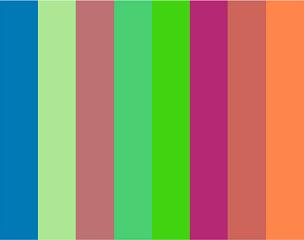
3 4 5 6 7 8]; These could be two of the five images. Since they are random colors, you’ll get different results. 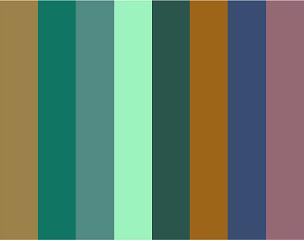
Third experiment: display predefined color
palettes
%
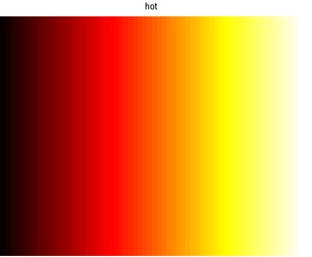
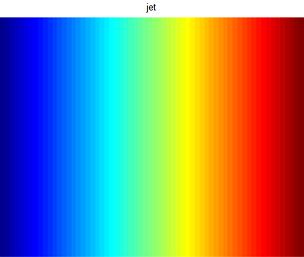
There are some color palettes already defined These are two of the palettes:
Now, the interesting part is that we can process images by either modifying the color palette or modifying the appropriate element(s) in the matrix to be displayed.
w =
fliplr(w); This is the graphic
result: 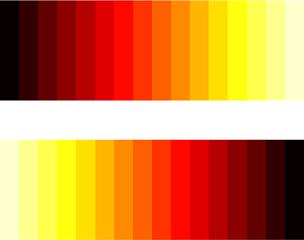 From 'RGB images' to home From 'RGB images' to 'Matlab programming' Sitemap
|


