Polar
Plots (with a little help from Matlab)
Matlab
provides functions that produce
polar plots
in appropriate coordinates using magnitudes
and angles.
In this article
we’ll discuss and show the Matlab built-in commands 'compass', 'polar'
and 'rose'.
The polar coordinate system is a two-dimensional system in which each
point on a plane is determined by a distance from a fixed point and an
angle from a fixed axis.
The Compass Function
The compass function
takes its inputs in Cartesian
format, but
outputs polar plots.
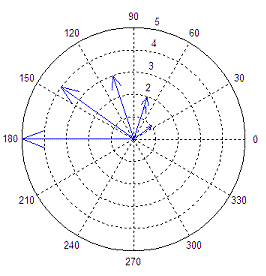
In the compass function each arrow’s length corresponds to
the magnitude of a data element and its pointing direction indicates
the angle
of the complex data. This function creates arrows that go out from the
origin
of the axes in a polar coordinate system. To illustrate this function,
we’ll
create a set of arrows that increase in size from arrow to arrow in a
counter-clockwise manner.
t = 1 :
5;
r = t .*
exp(i * t * 36 * (pi/180));
compass(r)
This code produces:

The Polar Function
The polar
function creates polar plots from angle and
magnitude
data.
It takes the forms
polar(theta,rho),
where theta corresponds
to the angle (in radians) and rho corresponds to the magnitude. The
variables
theta and rho must be identically sized vectors.
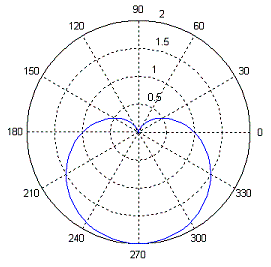
As an example, we create
a cardioid with the following code:
t = 0 :
2*pi/100 : 2*pi;
r = 1 -
sin(t);
polar(t,
r)
Here’s
the result:

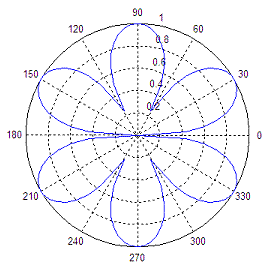
Here’s another polar
chart:
t = 0 :
2*pi/100 : 2*pi;
r =
sqrt(abs(sin(3*t)));
polar(t,r)

The Rose Function
With rose you can create angle histograms
that are drawn in
polar coordinates. By using rose(angle_data),
the function will determine how
many of the angles (in radians) fall within a given angular bin. By
default
there are 20 evenly spaced bins between 0 and 2pi.
The number of bins can be changed by using rose(angle_vector,
nr_of_bins), where the variable nr_of_bins is a
scalar specifying the number of
bins that should be spaced between 0 and 2pi.
You can also specify the centers of the bins by passing
a vector, bin_centers,
to the rose function, like this: rose(angle_vector,
bin_centers).
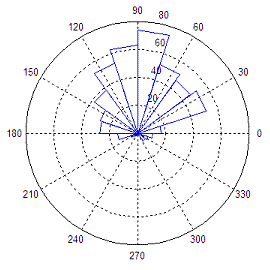
The following code
produces a rose plot of data which is
normally distributed in angle about 90º.
angle_vector =
angle(exp(i*randn(1, 500))) + pi/2;
rose(angle_vector)
This is the result of the
angle
histogram created with rose:


|

