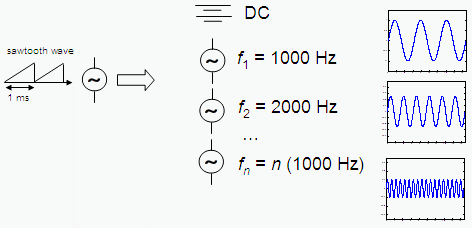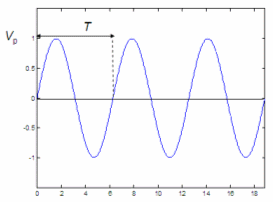

Fourier Analysis - introduction from a practical point of viewIn calculus or mathematics, Fourier analysis is a topic which grew from the study of Fourier series. This field began with the study of the way periodic or general functions might be represented by summations of simpler trigonometric functions (sine or cosine series).Fourier analysis has many applications in science, physics, digital signal processing, imaging, numerical analysis, acoustics... and in many other areas. We are going to comment on some electronic applications, where there are two emphasized domains: analysis in time domain, to find the voltages or currents at specific moments, and the analysis in the frequency domain, to study (in order to possibly manipulate) the frequencies present in a given signal. Fourier seriesThis figure shows a sine wave with a peak value Vp and a period T.
When AC analysis is presented in circuit theory courses, they usually focus on the sine wave because it helps understand many effects. Based on those effects or behaviors of electronic components we can start the study of non-sinusoidal signals. Periodic wavesThe shapes below (a half-sine, a sawtooth and a square wave) complete their basic form over a period T, and each cycle is an exact copy of the first period or cycle. This kind of waveform with repetitive cycles is called a periodic wave with period T.
In formulas: The fundamental frequency
f1
= 1 / T
Formulas for the Fourier series
periodic wave = DC component
+ Voltage v
is the
value of the periodic wave at any instant, this value can be calculated
by
adding the DC component and the instant values of all the the
harmonics. The
first term in the Fourier series is V0,
which is a constant and represents the DC component. The coefficients V1, V2...
Vn
are the peak values of the harmonics. The angular frequency w is equal to 2πf,
so you can
see that each term in the Fourier series represents the next higher
harmonic.
%
Define and plot one cycle of a square wave %
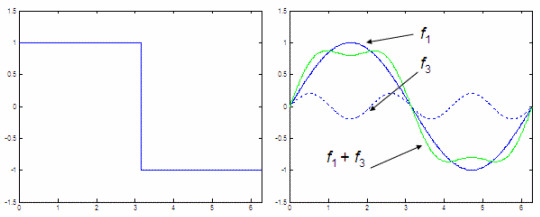
Plot f1 and f3 and add them up We get two figures:
The figure on the left is a plain square wave. We want to find an equivalent of that periodic wave by utilizing only sines. The figure on the right represents our first attempt to do it. We use the first and third harmonics of the original wave, we add them up and show the results. We can clearly see that the green line is getting closer to a square wave. In order to produce a better approximation, we’d need to adjust our amplitudes and include more terms in the series. Reference: Malvino, A. P.; Electronic Principles; 2nd. edition; McGraw-Hill Co., 1979. From 'Fourier Analysis ' to home From 'Fourier Analysis ' to Calculus Problems
|


